-
Authoradmin
-
Comments0 Comments
-
Category
-
Tag
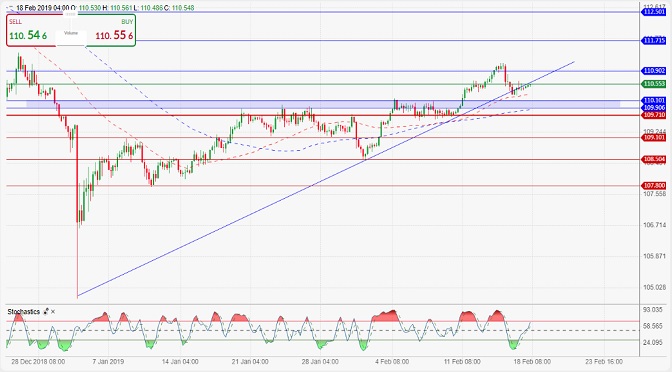
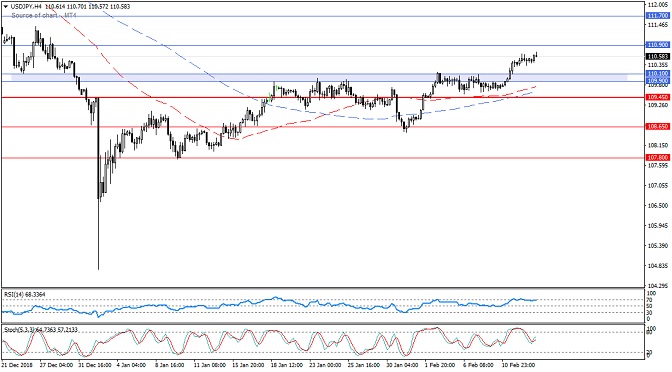
Weak trading around the uptrend line shown on the 4 hour chart and the highest support area 110.10 – 109.90 … The pair is currently supported by the SMA 50 … The possible bullish scenario remains intact as long as trades remain above 109.75 and the pair could resume its first target at 110.90 then […]
-
Authoradmin
-
Comments0 Comments
-
Category
-
Tag
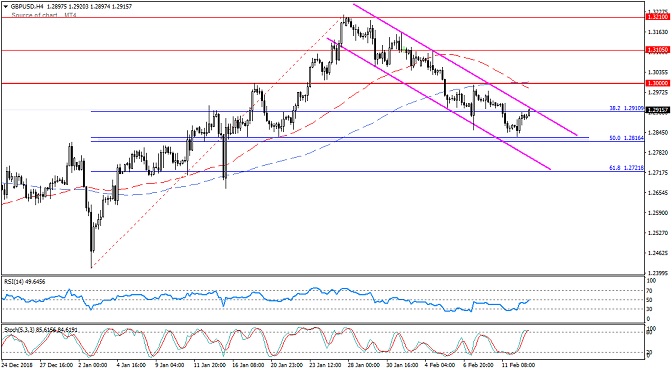
The pair was unable to hold below 50.0% Fibonacci at 1.2820 (the second target of the bearish scenario), rising strongly during last Friday’s trading, breaking the upper limit of the bearish channel shown on the 4 hour chart … Although the downside potential is now weak, As long as the trading remains below the resistance […]
-
Authoradmin
-
Comments0 Comments
-
Category
-
Tag
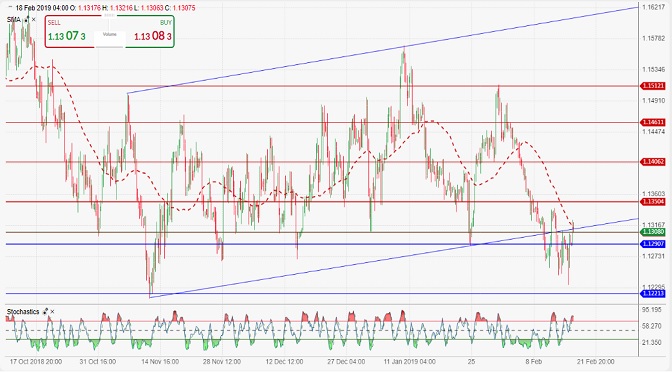
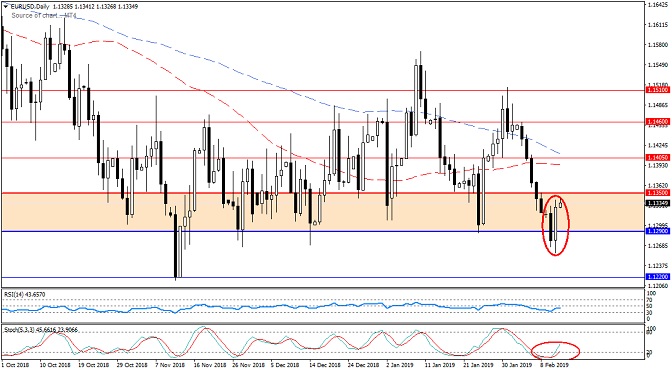
After he approached his third goal at the November bottom of 2018 around the 1.1220 pair rebounded during trading on Friday due to move near the lower limit of price channel breached shown on the chart for four hours … it faces price currently SMA 50 with the entry of Stochastic within the overbought area. […]
-
Authoradmin
-
Comments0 Comments
-
Category
-
Tag
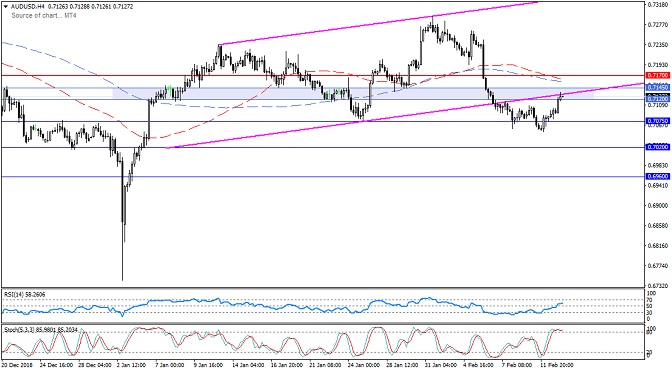
The pair has seen a rise during yesterday and today to move within the resistance zone 0.7120 – 0.7145 with Stochastic entering the overbought areas as seen on the 4 hour chart. The downside scenario remains valid as long as the pair remains below 0.7170, and the pair could resume its first target at 0.7075, […]
-
Authoradmin
-
Comments0 Comments
-
Category
-
Tag
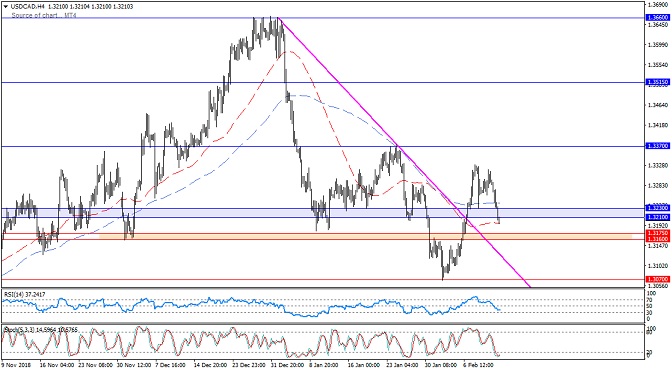
The pair witnessed a significant decline during today’s trading and morning trade, breaking the support area 1.3230 – 1.3210 The price is currently supported by the SMA 50 on the 4 hour frame with Stochastic is entering the oversold area …A return to the top of 1.3230 supports the possibility of a bullish move, and […]
-
Authoradmin
-
Comments0 Comments
-
Category
-
Tag
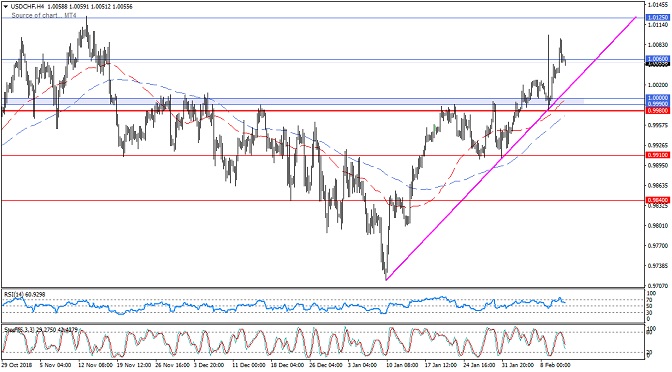
The pair is retreating after surpassing its first target at 1.0060 in an attempt to gain enough bullish momentum due to the bullish signals appearing on the momentum indicators … The possible bullish scenario remains intact as long as the pair remains above the bullish trend line shown on the 4 hour chart to remain […]
-
Authoradmin
-
Comments0 Comments
-
Category
-
Tag
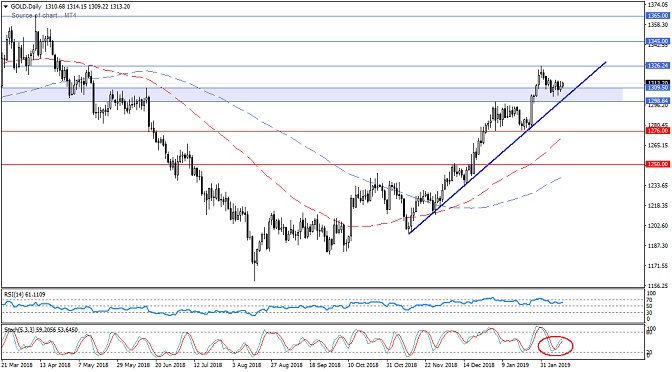
The price of gold is clearly supported from the 1309-1298 area supported by a rising trend line as seen on the daily chart … The RSI is still within the bullish momentum and Stochastic points to a positive cross … The upside potential remains valid as long as the trades remain above the mentioned trend […]
-
Authoradmin
-
Comments0 Comments
-
Category
-
Tag
Stability above the 109.90-110.10 area maintains the potential bullish scenario with targets around 110.90 as the first target and 111.70 as the second target … The overbought position on the RSI may press the price to retest the mentioned territory before heading to the potential targets. A break of 109.45 with a four-hour closing might […]
-
Authoradmin
-
Comments0 Comments
-
Category
-
Tag
The pair received support from 1.2830 – 1.2815 (50% Fibonacci), rising during the US session yesterday and morning intraday trading near the upper limit of the bearish channel shown on the 4 hour chart … Stochastic is floating within the oversold area and the RSI is still within the momentum zone Down below the 50 […]
-
Authoradmin
-
Comments0 Comments
-
Category
-
Tag
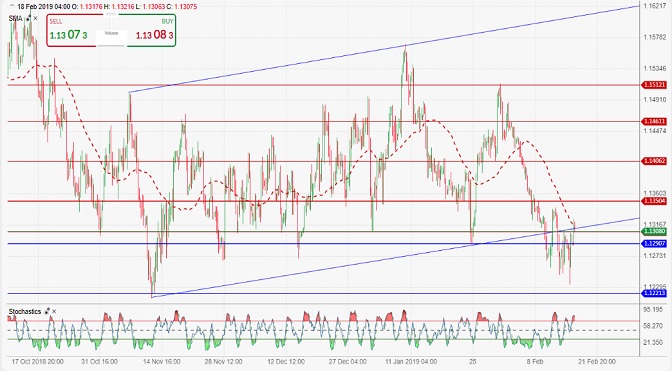
The pair has not been able to hold long below the support level 1.1290 because of the saturation of selling indicated by the indicators Stochastic and RSI on each of the four-hour time frames and day, to rise during the day yesterday, ending trading above the level mentioned … On the daily time frame note […]
Recent Comments
- Starlight Herot on Euro Higher on German Data, Sterling Edges Lower
- Frost Dragont on Euro Higher on German Data, Sterling Edges Lower
- Gwinnettt on Euro Higher on German Data, Sterling Edges Lower
- Vanessat on Euro Higher on German Data, Sterling Edges Lower
- Christinet on Euro Higher on German Data, Sterling Edges Lower
Archives
- April 2025
- March 2025
- February 2025
- January 2025
- December 2024
- November 2024
- October 2024
- February 2024
- July 2023
- July 2021
- May 2021
- March 2021
- February 2021
- September 2020
- May 2020
- February 2020
- December 2019
- November 2019
- October 2019
- September 2019
- August 2019
- July 2019
- June 2019
- May 2019
- April 2019
- March 2019
- February 2019
- January 2019
- December 2018
- November 2018
- October 2018
- September 2018
- August 2018
- July 2018
- June 2018
- May 2018
- April 2018
- March 2018
- February 2018
- January 2018
- December 2017
- November 2017

