-
Authoradmin
-
Comments0 Comments
-
Category
-
Tag
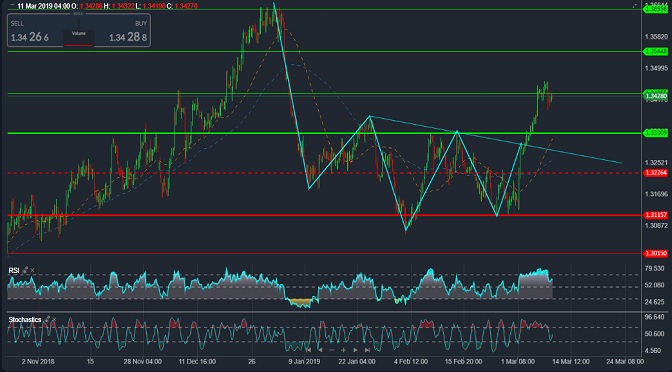
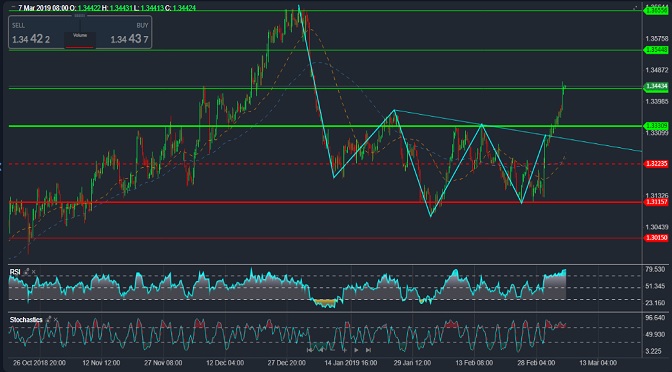
The price fluctuates around the first target level at 1.3435 … The possible bullish scenario remains valid with the effect of the upside down head and shoulders pattern shown on the chart to be the next targets around 1.3545 as the second target and then the 1.3655 resistance as the third target … A break […]
-
Authoradmin
-
Comments0 Comments
-
Category
-
Tag
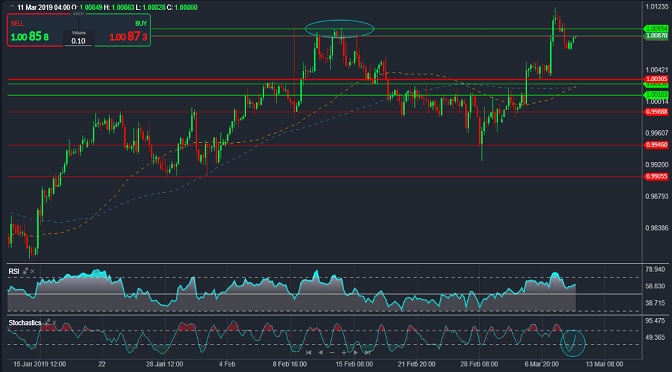
The pair rose strongly on Thursday, reaching its first target at 1.0095, to retreat on Friday in an attempt to gain some bullish momentum due to the saturation condition that was indicated by the Stochastic and RSI indicators on the four-hour framework, which shows positive signs now … The possible bullish scenario remains valid with […]
-
Authoradmin
-
Comments0 Comments
-
Category
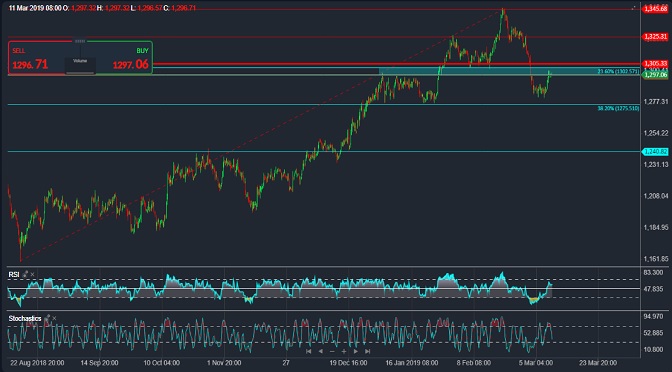
The price of gold rose last Friday to test the area 1300-1302 as expected due to the saturation of the sale was indicated by the momentum indicators … Stochastic pointing to a negative intersection is currently a sign that the price has gathered enough momentum to resume falling … The possible bearish scenario remains intact […]
-
Authoradmin
-
Comments0 Comments
-
Category
-
Tag
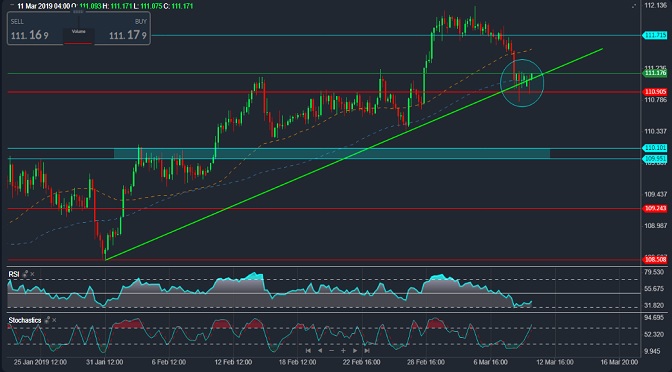
Although the upside scenario which achieved its second target at 111.70 has become weak after breaching both the 50 and 100 averages, it remains intact with support at 110.90 which corresponds to the bullish trend line shown on the 4 hour chart and is trying to support the price as we see … The return […]
-
Authoradmin
-
Comments0 Comments
-
Category
-
Tag
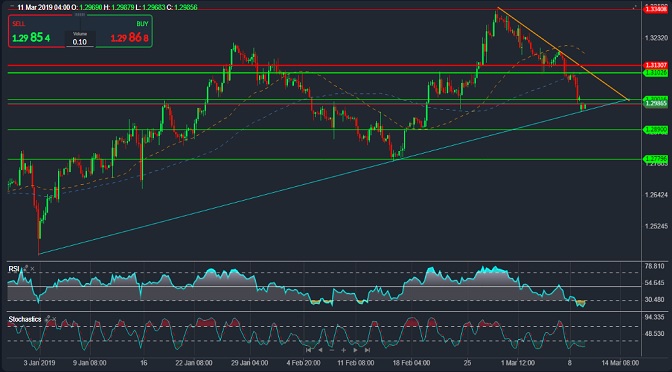
A break the support level of 1.3100 was sufficient to activate the bearish scenario and push the price aggressively towards its first target at 1.3000 … The pair is currently supported by the bullish trend line shown on the chart as momentum indicators are moving within the oversold zones. The bearish trend is shown in […]
-
Authoradmin
-
Comments0 Comments
-
Category
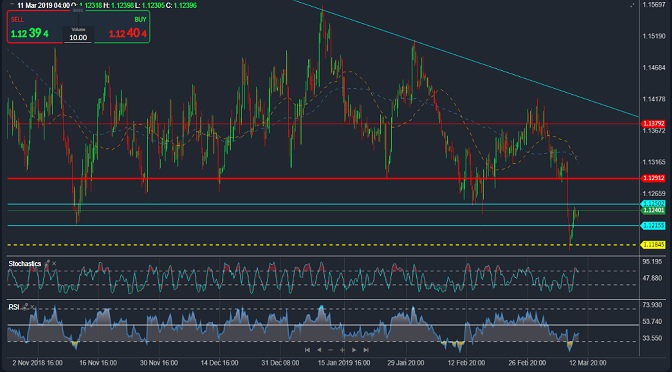
The pair fell strongly to reach its third target of the downside scenario at 1.1235 last Thursday to resume trading higher on Friday in an attempt to test the 1.1215-1.1240 breached support area after receiving support from 1.1185 of 61.8% Fibonacci of the wave that started from the bottom of 01/01 / 2017 and ended […]
-
Authoradmin
-
Comments0 Comments
-
Category
-
Tag
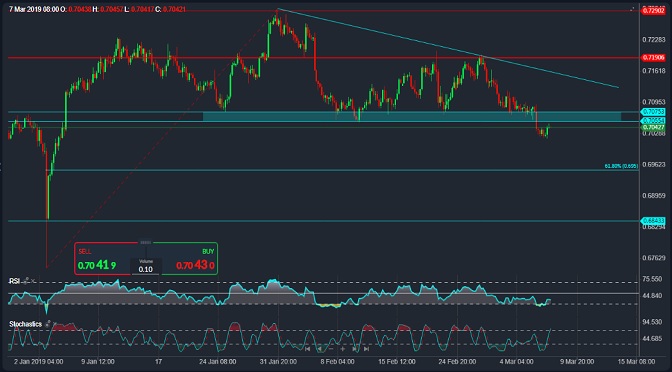
The pair is approaching the breached support area at 0.7055 – 0.7075 and we see on the 4 hour chart that it is possible to press the price to reach 61.8% Fibonacci at 0.6960 as the first target and the breach may extend from the downside wave to support the 0.6840 support as the second […]
-
Authoradmin
-
Comments0 Comments
-
Category
-
Tag
The pair rallied strongly on Tuesday and Wednesday, influenced by the upside-down pattern of the head and shoulders pattern shown on the 4-hour chart to achieve its first target at 1.3440, which is currently moving around it … This trend is likely to remain for the next targets around 1.3545 as the second target and […]
-
Authoradmin
-
Comments0 Comments
-
Category
-
Tag
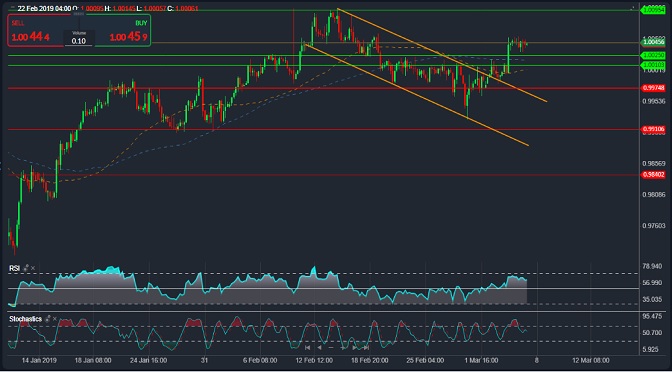
A clear breach by the pair to the area resistance 1.0010 – 1.0025 during Tuesday trading to return during the day yesterday in an attempt to re-test and gather enough momentum upward as we note on the four-hour framework, it may be enough to activate the scenario of upward is located the first target around […]
-
Authoradmin
-
Comments0 Comments
-
Category
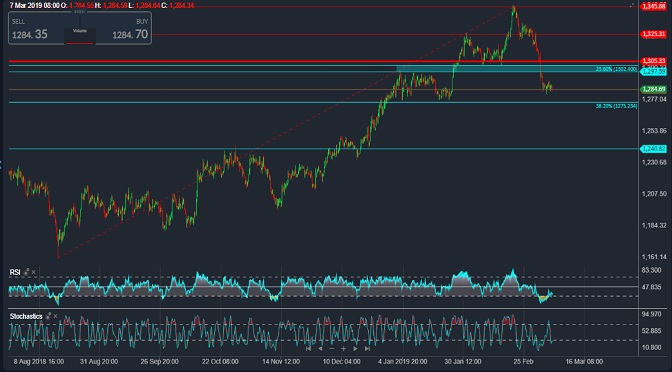
The pair has moved sideways over the past two days in an attempt to gain bearish momentum due to the oversold resistance shown on the RSI on the daily basis … The 1300-1302 rally seems to be possible but the possible bearish scenario remains intact as long as the trading remains below 1305 (23.6% Fibonacci) […]
Recent Comments
- Starlight Herot on Euro Higher on German Data, Sterling Edges Lower
- Frost Dragont on Euro Higher on German Data, Sterling Edges Lower
- Gwinnettt on Euro Higher on German Data, Sterling Edges Lower
- Vanessat on Euro Higher on German Data, Sterling Edges Lower
- Christinet on Euro Higher on German Data, Sterling Edges Lower
Archives
- November 2024
- October 2024
- February 2024
- July 2023
- July 2021
- May 2021
- March 2021
- February 2021
- September 2020
- May 2020
- February 2020
- December 2019
- November 2019
- October 2019
- September 2019
- August 2019
- July 2019
- June 2019
- May 2019
- April 2019
- March 2019
- February 2019
- January 2019
- December 2018
- November 2018
- October 2018
- September 2018
- August 2018
- July 2018
- June 2018
- May 2018
- April 2018
- March 2018
- February 2018
- January 2018
- December 2017
- November 2017

