18
Feb
Technical Analysis – GOLD _ 18-02-2019
-
Authoradmin
-
Comments0 Comments
-
Category
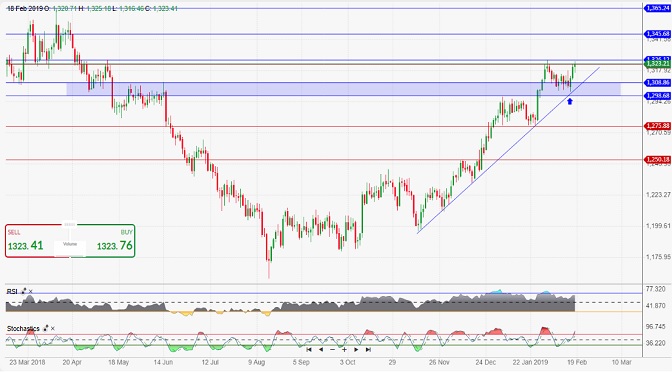
With the support of the rising trend line supported by the support area 1309-1298 rose the price of gold during trading on Friday and today touching its first target at the resistance 1326 … Stochastic and rsi momentum indicators indicate a bullish momentum may push the price to try to break through the resistance mentioned and targeting 1345 as a second target and resistance 1365 As a third goal.
A breach of the bullish trend line shown on the daily chart may be enough to end the upside potential, and then the price could then head to test the 1276 support as the first target and then support the 1250 as the second target.
Tags:
Related Posts
Recent Comments
- Starlight Herot on Euro Higher on German Data, Sterling Edges Lower
- Frost Dragont on Euro Higher on German Data, Sterling Edges Lower
- Gwinnettt on Euro Higher on German Data, Sterling Edges Lower
- Vanessat on Euro Higher on German Data, Sterling Edges Lower
- Christinet on Euro Higher on German Data, Sterling Edges Lower
Archives
- April 2025
- March 2025
- February 2025
- January 2025
- December 2024
- November 2024
- October 2024
- February 2024
- July 2023
- July 2021
- May 2021
- March 2021
- February 2021
- September 2020
- May 2020
- February 2020
- December 2019
- November 2019
- October 2019
- September 2019
- August 2019
- July 2019
- June 2019
- May 2019
- April 2019
- March 2019
- February 2019
- January 2019
- December 2018
- November 2018
- October 2018
- September 2018
- August 2018
- July 2018
- June 2018
- May 2018
- April 2018
- March 2018
- February 2018
- January 2018
- December 2017
- November 2017


