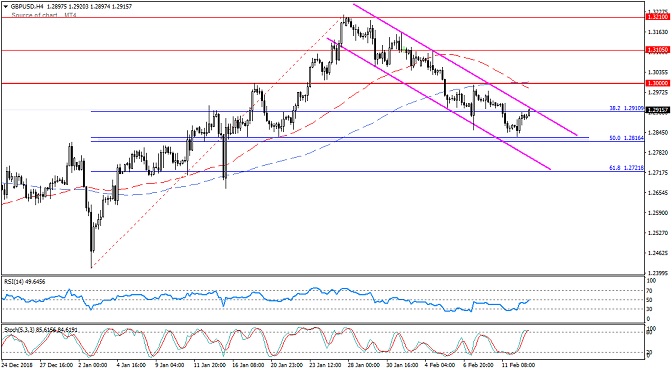
The pair received support from 1.2830 – 1.2815 (50% Fibonacci), rising during the US session yesterday and morning intraday trading near the upper limit of the bearish channel shown on the 4 hour chart … Stochastic is floating within the oversold area and the RSI is still within the momentum zone Down below the 50 line.
The potential bearish scenario remains intact as long as the pair remains below 1.3000 and the pair may resume its decline to 1.2830-1.22815 (the second target of the downside scenario), which could push the price directly to 61.8% at 1.2700 – 1.2720 as the third target.
A breach of the bearish trend formation, which is confirmed by a four-hour closing above 1.3000, might be enough to end the downside scenario. The price could then push towards 1.3105 as the first target and then 1.3210 as the second target.